torstai 24. maaliskuuta 2022

My three years as a data journalist with the EBU

It was back in March 2019 when I started to work as a data journalist at the European Broadcasting Union in Geneva. Now in March 2022 this chapter closes and it is time to look back and move on.

I remember that when I started I had a very clear vision in my head on what I was going to do and how I was going to improve the overall level of data journalism within the EBU and the PSM family as a whole. These three years have shown and taught me that the reality of cross-border and cross-organisation cooperation is always more difficult than you think in advance.

But still I was able to do and accomplish a lot. I covered many important topics ranging from climate change via Covid-19 to F1. In total I created almost 70 data projects for the members to use which is more than 20 a year. This is huge amount as I also had other responsibilities other than just providing content for the members. I managed the data journalism community and organised trainings for the members and helped them with various projects. Organising events and preparing materials takes a lot of time. So I would say the time was very successful, maybe just not in a way I thought it would be. 

The time with the EBU has been rewarding but just different from what I expected. 

And I have to say to work as a data journalist for a member organisation like EBU where the members are completely different from each other during a pandemic has also been challenging to say the least. In a way working remotely helped the communications with members as everyone became more familiar with online tools but it made the integration with EBU Newsroom more tricky.

In hindsight I think I should have integrated more with the people in the Newsroom. Now I my role was a bit too isolated from the day to day operations. Overall I think I failed to advertise the work that I did. Not enough people were aware of my of what I was doing and offering. This was partly due to the fact that I wasn't connected enough with the rest of the Newsroom.

From the organisation's point of view the constant crisis because of the pandemic mode also prevented EBU to give the data journalism project the required focus. I think whenever you are starting something new you should make it a priority at the highest level – especially in the beginning. 

I want to thank EBU for this time and especially all the great colleagues and many friends I received <3


keskiviikko 23. syyskuuta 2020

Reflections on the first year of the EBU’s data journalism community

We offer the members data news items.

I have been working as a data journalist for almost ten years and I have had the privilege of working on many interesting projects over the years.

In 2012 I joined the Yle, Finland’s national public broadcasting company and I was fortunate enough to follow closely on how the organisation successfully transformed from a traditional broadcaster into a forward-thinking media company.

Data and online Journalism was just gaining popularity and I immersed myself into this new world.

So when I joined the EBU in 2019 I thought I had a clear plan on how to integrate data journalism into the EBU’s framework.

I thought I knew the pitfalls and that I was prepared to fully communicate with the members. After all, I had been working for one of the members for a long time and I thought I knew exactly what the members needed and wanted.

The first year with the EBU showed me how little I knew. I realised implementing certain frameworks would be harder and understandably slower than I had imagined. 

Building and maintaining contacts was an essential, yet time-consuming task.

I was naive to think that members would automatically get excited about every project or initiative I had in mind.

I needed to learn how to advertise my work and how to create hype around it. Also, I have to say that my assumptions on what the members wanted turned out to be, if not completely faulty, not quite accurate.

On the other hand, I have learned that timing is critical when it comes to long-term projects. Even if you organise a perfect conference but when the timing is off, people might miss it completely.

At the same time, projects that you don’t expect to fly, will do so.

I have also learned how to face the unexpected. It has not been easy because I function better when there is order. I was also used to do everything on my own and now my job involves inspiring and motivating others, finding them opportunities to develop and etc.

To summarise, the first year and a half has been challenging and different to what I had in mind. However, the work turned out to be rewarding and fun. 

I’d like to emphasise that everyone has been very supportive, both in the office here in Geneva and the members. The feedback has been very positive and together we’ve achieved a lot. Just to mention a few:

  • The 5th EBU data journalists meet-up.
  • COVID-19 related teleconferences and COVID-19 related News items.
  • News items on climate change.
  • Training sessions organised together with the EBU Academy.
  • Targeted focus groups like the US elections.

In the future, I’m planning to listen more to our members’ needs and react more quickly and timely to changing circumstances.

We have had good showcases with the COVID-19 and data teleconference and with the US elections focus group. With both, we have been able to exchange important information between members.

keskiviikko 18. joulukuuta 2019

EBU Data Journalism Community eyes growth, further collaboration in 2020


Countries and members that have already made use of the data projects provided by the EBU News Exchange include Ireland (RTÉ), Germany (DW), France (FR24), Poland (TVP), Croatia (HRT), Switzerland (SRF), Finland (Yle). The Map was made with Mapchart.

We are nearing the end of the decade and I thought it was a good moment to catch up with you in terms of the data journalism initiative. If you are not familiar with the initiative you can catch up with the previous posts from this blog.

I have just two points!

FIRSTLY we have continued to share data stories and visualisation for you via the News Exchange and Social Newswire and we are keen to do this also in the future.

Here are some examples of the stories that we have provided to the members.

  • Visualisation of Bitcoin value skyrocketing over the course of its existence
  • Animation shows the evolution of the Arctic ice cap surface from 1979-2019
  • Animation shows changes in temperature per country from 1901-2016

For example SRF/Switzerland used the Polar Ice Cap video on the SRF News Instagram account and the video got over 12,000 views. Another example comes from TVP/Poland who made use of the Bitcoin visualisation on their Facebook account. And just today DW/Germany released the temperature animation on their DW News Twitter account.

–––––––––––––––––––––

SECONDLY I’m keen to support the collaboration between EBU members. In September we organised a meeting in Hamburg for the members and we are planning to have the next event in the spring. We are also working together with the EBU Academy.

We are also looking into supporting data journalist exchange. We have a great community but we should and could learn more from each other. One way to accomplish this is to work with each others hands-on.

maanantai 3. kesäkuuta 2019

EBU data journalism status update

EBU has now had a data journalist in the for two and half months and it is time to catch up what we have accomplished. We’ve focused mainly on three areas.

1. Creating the community


We have been starting to plan events and we are organising an event on fact-checking on 25th of June. We have about 30 people joining us in Geneva. Fact checking has a strong link with data journalism.

For data journalists we organised a conference call in May and the 4th data journalist meeting is also planned in Autumn. Before we have met in Milan, Geneva and London.

To support communication we have promoted the data journalism mailing list which now has over 50 people on it. The amount of members on this list has almost doubled in past months. We will use the mailing list on informing about events.

We also have an existing Facebook group which we are now starting to activate.

2. Implementing data story templates


We have started to implement data story templates. The idea in this is to create wireframes that EBU members can develop further to make into journalistic stories. Members are able to translate, to localise and to implement their company styles. This can be together with EBU. The projects can be hosted on member's own CDNs.

3. Data story exchange


We've asked members to share their best data story examples with could be share with other members. Some of the data stories that members publish on their own audience have more wider interest and these could be quite easily transported from one member to another. There can be some technical issues but we can tackle those.

So far the most concrete example have come from SVT. They built an interactive quiz which challenges the reader in a fun way to know about the past events in European history.


tiistai 9. huhtikuuta 2019

Teemo Tebest: Meet the News Exchange’s new data journalist

Kirjoitin itsestäni ja työstäni esittelytekstin EBU:lla sisäisesti. Jaan tekstin myös tässä.


My name is Teemo Tebest. Nice to e-meet you all. I’m from Finland and I’ve just joined the EBU for two years to work as a data journalist.

What is a data journalist you may ask?


For the last six+ years I’ve have been working for the Finnish Broadcasting Company (Yle) as a full-time data journalist in a team called the Plus Desk.

The Plus-team consists of programmers and graphic designers and together with the news teams we’ve established an ongoing operation where we produce data based journalism, visual journalism and online journalism with other news teams.

In general, one could say a data journalist is a journalist who has technical or even programming skills. Data journalist turns data into understandable journalism.

As for my background – I’m a programmer and I have a Master’s Degree in Information Technology. I studied information visualization, user interface design and user experience design.

In information visualization you study how to make complex things more understandable through ways of visualizations. Visualization can be a map, a bar graph. In my opinion, written text can act as a visualization if it delivers the message in the most efficient way.

What is data journalism?


At Yle, the Plus-team did operated together with other news teams. For example, if we created a story around the parliamentary elections we would team up with someone from the politics team. This task force of a journalist, a programmer and a graphic designer would come up with the best solution to tell the story at hand. Below are some examples of stories that we created at Yle:

Child molesters

In this story we asked the courts in Finland for all the cases where there was a prosecution on child abuse since 2018. We got over 600 PDF documents, some of them were scanned. We used OCR to get these PDFs into a machine readable format and turned them into a database with Python. Then we tailored an interface and a story where reader can go through all the cases. While the public eye often focuses in individual cases, this story showed the more overall situation through the ways of data journalism.

Municipality radar

In this story we looked into the situation in Finnish municipalities. With experts we selected and gathered 40 datasets in different areas of life that defined the situation of a municipality. These datasets were stored and combined in Google Sheets. The datasets were then divided into four categories:
  • Economics
  • Future
  • Health of the citizens
  • Atmosphere
The situation for a municipality in these categories was presented via 5-star-rating system. This was a comprehensive project and it was adopted by the citizens but also by the city council members.

Die Mannschaft against the Man

This story is not necessarily a data story but it shows what can be done while having programming and graphic design knowledge in the newsroom. This story was created for the World Cup and it showed how in the previous World Cups Argentina (and Messi) had always lost to Germany in their tournament elimination match. These kind of tailored feature stories can be made in any way of your imagination (and resources).

What next?


Data journalism gives a newsroom new ways of telling stories. Data journalism should be considered as a tool which enables enriching your storytelling. Data and visualizations are very effective and immersive as you can see from these two examples:

I'm here for you! If you have any ideas or suggestions on how EBU and I should proceed together with you. I have many ideas but I’m all ears. Some ideas what I have thought include following:
  • Data journalism code storage for sharing code between members
  • Data journalism data storage for sharing data between members
  • Data visualization templates for the members
  • Best practices introductions, how-tos, etc
  • Collaborative data projects with and between members on cross-border subjects like climate change
  • Consulting members' ongoing projects
  • Workshops, meetings, classes and courses
  • EBU could also provide data and visualizations in breaking news situations

    perjantai 8. helmikuuta 2019

    Datajournalismia, täältä tähän ja mitä seuraavaksi

    Olen Teemo Tebest, tämän datajournalismiblogin kirjoittaja (Kuva 1). Tämä kirjoitus kertoo miten minusta tuli ammattillinen minä ja mitä seuraavaksi.

    Minä jalkapallon EM-kisojen studiossa Pasilassa 2018. (Kuva 1)

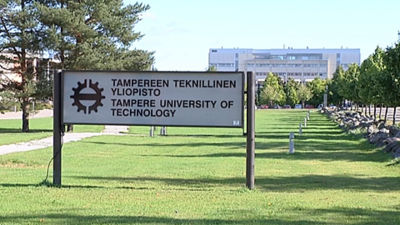
    Aloitin yliopisto-opintoni vuonna 2003. Minut valittiin Tampereen teknillisen yliopiston Porin yksikköön opiskelemaan tietotekniikkaa (Kuva 2). Yliopistomaailma ja sen vaatimukset olivat minulle melko suuri harppaus lukiosta.

    Porissa opiskelijaelämä oli hyvin vähäistä ainakin Yliopistokeskuksella. (Kuva 2)

    Ensimmäinen puoli vuotta ennen armeijaa menikin lähinnä katsellessa. Syksyllä 2004 aloitin ensimmäisen kokonaisen lukukauteni. Tavoitteeni ja motivaationi armeijan jälkeen oli opiskella niin ahkerasti, että pääsisin vaihtamaan opinto-oikeuteni Porista Tampereelle. Poriin en halunnut jäädä.

    Porista Tampereelle


    Pääsin lopulta Tampereelle sekä sisäisellä siirrolla hyvän opintomenestyksen ansiosta kuin pääsykokeidenkin kautta lukukauden 2005 alusta (Kuva 3). Ensimmäiset vuodet Tampereella olivat rankkoja. Uskon, että monille perusopinnot tuottavat tuskaa ja niin myös minulle. Etenkin, kun opintoihin liittyivät myös maisemanvaihdos ja yleisesti aikuistuminen.

    TTY:n etunurmi oli monien hauskojen muistojen tapahtumapaikka. (Kuva 3)

    Muistan, että matematiikan ja fysiikan kursseja oli todella paljon, ja asiat olivat vaikeita. Myöskään ensimmäiset koodauskurssit eivät tuntuneet omilta. C++ ei ollut sellainen kieli, joka minulle olisi tullut luontevana. Vähitellen tuohon kaikkeen toki orientoitui ja aloin luottaa, että kun asioihin satsaa, niistä myös selviytyy.

    Vuoden 2007 aikoihin löysin Hypermedialaboratorion tarjoamat kurssit. Niissä opiskeltiin web-teknologioita kuten Javascriptiä, PHP:tä, XML:ää ja HTML:ää sekä käytettävyyttä ja verkkopalvelujen suunnittelua. Nämä tuntuivat mielekkäiltä, vaikka opiskelukaverit pitivätkin näitä kursseja lähinnä "käsienheilutteluna". (Kuva 4)

    Web-teknologiat eivät olleet vielä yliopistoaikanani koulutuksessa suuressa arvossa. (Kuva 4)

    Vuodesta 2007 lähtien opiskelin todella aktiivisesti erilaisten web-teknologioiden käyttöä. Tuolloin perustin myös Statster-nimisen verkkopalvelun, jonka kautta koodaamisesta ja sen opettelusta tuli minulle myös harrastus, jossa tunteja ei laskettu. Vuosina 2007 ja 2008 opin koodaamaan. Pääosin tein PHP:ta ja Javascriptiä.

    Opinnoista työelämään


    Loppuvuonna 2008 Jukka Huhtamäki vinkkasi minulle, että Hypermedialaboratoriossa olisi tutkimusapulaisen paikka auki. En ollut ikinä tehnyt oman alani töitä ja nyt siihen tarjoutui mahdollisuus. Hain paikkaa – ja sain sen. Tuo oli minulle erittäin suuri suuri askel. Lopulta tein töitä tutkimusapulaisena ja tutkijana töitä yhteensä kolme vuotta vuodesta 2009 vuoden 2011 loppuun. Olen tästä mahdollisuudesta todella kiitollinen Jukalle ja koko porukalle siellä. Hypermedialaboratorio oli erinomainen paikka kasvaa ja kehittyä koodaajana sekä opetella informaation visualisointia.

    Tutkin siis yliopistolla informaation visualisointia ja tein jatko-opintoja sekä tutkimuspapereita. Tutkijan työ ei kuitenkaan tuntunut täysin omalta. En tiennyt vielä silloin, mikä minua todella kiinnosti, vaan olin enemmän “vain töissä”. En kokenut kutsumusta, ja tutkijan työn prosessien verkkaisuus ei motivoinut minua oikealla tavalla.

    Olin kuullut datajournalismista, joka oli tuolloin 2010–2011 nouseva termi Suomessa. Erilaiset yksittäiset tapahtumat, kuten Tampereella järjestetty Datajournalismin päivä, HSOpen-tapahtumat ja se, että loppuvuonna 2011 perustin tämän blogin, ohjasivat minua alitajuntaisesti siihen, että kun näin, että Ylelle haetaan tekijää ajattelin, että se voisi olla mielenkiintoinen paikka.

    Yliopistolta Svenska Ylelle


    Svenska Ylen työpaikkailmoitus tuli eteeni siis syksyllä 2011, ja edellä mainituista syistä päädyin hakemaan tuota web-kehittäjän työtä. Muistan, miten ajoin junalla Tampereelta Helsinkiin ja ensimmäistä kertaa astelin Ylelle - ja etenkin sen hetken, kun astelin haastattelusta pois. Päällimmäiseksi jäi tunne, että tänne haluan. (Kuva 5)

    Yle ei opintojen aikana ikinä tullut mieleen paikkana, jossa voisin olla töissä. (Kuva 5)

    Sainkin paikan web-kehittäjänä, pitkälti Drupal-osaamiseni vuoksi. Drupal-osaajia ei tuolloin juuri ollut saatavilla, joten tällainen keskinkertaisempikin Drupal-koodari kelpasi. Drupalia olin opetellut ja tehnyt yliopistolla tutkimustyön ohella. Aivan mahtavaa Svenska Yle, että otitte minut tiimiin. Kiitos Kristoffer Söderlund ja Sami Kallinen. Tuolloin muutto Tampereelta Helsinkiin oli toisaalta todella iso askel, mutta toisaalta hyvin luonteva siihen elämäntilanteeseen.

    Svenska Yleltä Plus-deskiin


    Vuoden 2012 lopulla Yleen oltiin perustamassa Plus-deski -nimistä tiimiä, jonne etsittiin yhtä koodaustaitoista toimittajaa, ja hain tätä paikkaa. Olin vuoden 2012 aikana tehnyt myös journalistisia projekteja web-kehittäjän työni lomassa. Tein esimerkiksi vaalianalyysejä, tutkin perussuomalaisten äärikytköksiä ja visualisoin alkoholin myyntitietoja. Näitä juttuja julkaistiin niin täällä blogissani, kuin Svenska Ylen ja Yle Uutisten sivuilla.

    Datajournalismi ja journalismi yleisesti tuntuivat todella mielenkiintoiselta haasteelta. Olin todella innoissani, kun sain tehdä projekteja toimittajien kanssa. Vaikka en ollut koskaan ajatellut, että minusta tulisi toimittaja, niin työnä se kiehtoi. Pääsin tekemään asioita, joiden kuluttaja olin ollut. Ja kerrankin tein työtä, jonka pystyisin selittämään äidille. Työn nopeatempoisuus ja työskentely muiden kuin teknisten ihmisten kanssa olivat varmasti myös selittäviä tekijöitä sille, miksi journalismi kiehtoi.

    Minut valittiin tuohon mainittuun koodaavan toimittajan tehtävään Plus-deskiin (Kuva 6). Hyppäys Svenska Yleltä Yle Uutisten puolelle oli aikanaan iso ja vaikea päätös, koska Svenska Ylellä asiat toimivat ketterästi ja valtava Yle Uutisten koneisto vaikutti ulkoapäin jähmeältä. Etenkin kun samaan aikaan Svenska Ylelle oltiin myös perustamassa datajournalistista tiimiä, johon minut haluttiin. Mika Rahkonen sai kuitenkin vakuutettua minut ottamaan paikan Plus-deskissä vastaan. Muistan elävästi, kun kysyin häneltä lounastapaamisessa: "Onko ongelma, etten ole oikein hyvä auktoriteettien kanssa". En muista mitä Mika vastasi, mutta vastaus miellytti, ja suurempi vastuu ja isommat piirit kuitenkin kiinnostivat.

    Plus-tiimi joulukuussa 2016. Vasemmalta: Juho Salminen, Eemeli Martti, Stina Tuominen, Juha Rissanen, Teemo Tebest, Mika Pippuri, Anna Hurtta ja Ville Juutilainen. (Kuva 6)

    Tiedostan, että urallani on ollut henkilöitä, jotka ovat tukeneet ja uskoneet minuun oikeilla hetkillä. Tämä on ollut todella arvokasta. Ja näitä henkilöitä on myös paljon mainittujen lisäksi.


    Plus-deskissä kasvoin ammattilaiseksi omassa työssäni


    Vuodesta 2013 olen siis työskennellyt täysipäiväisesti datajournalistina ja toimittajana Ylen Plus-deskissä. Työssäni olen tehnyt Suomen suosituimpia verkkosisältöjä yhdessä tiimin ja muiden toimitusten kanssa. Tämä aika on ollut erittäin (erittäin) mielenkiintoista ja palkitsevaa. Olen saanut tehdä journalismia ja sisältöjä todella osaavien ja asiantuntevien tyyppien kanssa.

    Näinä reiluna kuutena vuotena minusta on tullut myös erittäin kysytty puhuja kouluihin ja konferensseihin. Olen kiertänyt puhumassa Suomessa lukuisissa paikoissa, niin yliopistoissa kuin korkeakouluissa sekä seminaareissa ja tapahtumissa. Lista maista, joissa olen lisäksi käynyt on venähtänyt jo mukavaksi: Norja, useamman kerran Ruotsissa, Tanska, kahdesti Virossa, USA, Englanti, Italia ja pari kertaa Sveitsissä. Kattoteema näillä keikoilla on ollut aina sama – datajournalismi. (Kuva 7)

    Esiinnyin Tallinnan musiikkiviikkojen yhteydessä pidetyssä tapahtumassa keväällä 2018. (Kuva 7)

    Kiitos Hypermedialaboratorio ja tyypit siellä. Kiitos Svenska Yle, että otitte minut aikanaan Ylelle. Ja kiitos osallisille Yle Uutisissa, että palkkasitte minut Plus-deskiin. Kiitos koko Plus-deskin väki ja kaikki te, joiden kanssa olen saanut tehdä töitä. Te kaikki olette tehneet minusta ammattilaisen alallani!

    Ja vaikka ovi ei Ylelle sulkeudu lopullisesti, nyt on aika siirtyä eteenpäin ja hakea uutta haastetta. Tähän minulle tarjoutui oiva mahdollisuus, sillä…

    Alpit mielessäin. (Kuva 8)


    Lähden datajournalistiksi EBU:uun, Geneveen


    Edessä on siis muutto Sveitsiin, Alppien juurelle. (Kuva 8)

    Tuleva työtehtäväni on uusi ja sen tarkoituksena on viedä yleisradioyhtiöiden datajournalismia ja -osaamista kokonaan uudelle tasolle. Tehtävässäni koulutan ja vien datajournalistista osaamista eteenpäin Euroopassa. Käytännössä tämä tarkoittaa datajournalistisen osaamisen viemistä ruohonjuuritasolle EBU:n jäsenorganisaatioissa ja tarkoituksena on myös tiivistää organisaatioiden välistä yhteistyötä. Lisäksi tavoitteena on tuottaa datajournalistisia juttuja jäsenorganisaatioiden käyttöön.

    Haaste on iso, mutta olen siitä todella innoissani (kuva 9) ja pyrin kirjoittamaan kuulumisia tänne blogiin.

    Party On! (Kuva 9)

    torstai 30. elokuuta 2018

    Datajournalistin työkalupakki – verkosta löytyvät palvelut

    Käytän työssäni useita ilmaisia, verkosta löytyviä palveluita. Tässä listaa niistä.

    Mr. Data Converter

    Mr. Data Converter on loistava palvelu, jonka avulla pystyy muuntamaan .csv-tiedostoja eli Excel-tiedostoja .json-formaattiin. Työkalu on tarpeellinen, koska vaikka datajournalistisia aineistoja käsitellään Excelissä niin jos niistä halutaan tehdä jonkinlainen interaktiivinen toteutus on usein hyödyllistä jos data on Javascriptin suoraan ymmärtämässä .json-formaatissa.

    Mr. Data Converter:lla pystyy muuntamaan .csv-tiedoston useaan eri .json-rakenteeseen, joka on myös todella hyödyllinen ominaisuus. Palvelulle eivät ole ongelma edes suuri datan määrä, koska muunnos tehdään käyttäjän selaimessa.

    JSONLint

    JSONLint on palvelu, jonka avulla voi tarkistaa onko .json-tiedosto validia. Eli onko syntaksissa virheitä. Palvelu voi liittää halutun .json-koodin, jonka se validoi ja formatoi ja näyttää mahdolliset virheet. Vastaavia palveluita on netissä useita, mutta tämä on enemmän tai vähemmän sattumalta se, joka on itselle tarttunut.

    Näppärä etenkin kun .json-tiedostoista ei aina ole helppoa huomata missä syntaksivirhe on.

    CodePen

    CodePen on verkossa toimiva työkalu, jolla on mahdollistaa selaimessa Javascript-koodin tuottamisen ja ajamisen. Hyvä työkalu jos esimerkiksi haluat jakaa koodia tai haluat muuten vain koodata, mutta sinulla ei ole käytössäsi työkaluja siihen.

    Olen käyttänyt työkalua myös esimerkiksi kun olen kouluttanut koodaamista toimittajille. CodePen mahdollistaa myös kolmannen osapuolen kirjastojen tuomisen projektiin, joka on erittäin hyvä ominaisuus.

    Mygeodata

    Paikkadataa voidaan esittää monissa eri formaateissa. Esimerkiksi Google suosii omaa KML-formaattiaan, toisinaan taas .geojson on mielekkäin tiedostomuoto. Mygeodata palvelulla pystyy tekemään useita muunnoksia.


    Tässä joitain, heitä kommenteissa omia ehdotuksia?